
How to Use TradingView: From Your First Chart to a Trading Plan

- How to Use TradingView: Essential Features and Tools
- TradingView Tutorial: Set Up the Platform to Use TradingView
- Chart Guide: Candles, Timeframes, and Comparisons
- Indicator Guide: Add, Adjust, and Remove Studies
- Tools for the market: watchlist, screener, and the economic calendar
- How to use TradingView effectively?
- Strategy tutorial: test an idea before placing an order
- The difference between free and paid TradingView plans
- Brokers and execution: from TradingView analysis to MT5
A trader in Jakarta can pull up a USD/IDR chart, mark a potential breakout, and set an alert before the New York open. TradingView keeps all of that on one screen. But the interface can get crowded, so the smart order is to pick the right instrument, set the timeframe, look at the price, and only then add supporting tools. This guide walks through that sequence from your first chart to a test trade.
The shortest path across the platform goes like this:
- Create a TradingView account and open Supercharts.
- Search for a symbol and check its data source.
- Set a chart type, timeframe, and local time zone.
- Add one drawing and one indicator, then save the layout.
- Set an alert, review scheduled events, and test an idea before risking capital.
TradingView offers market analysis and simulated trading. Real orders need a supported broker connection. Charting a price alone never opens a position. This guide on how to use TradingView covers chart controls, analysis tools, screeners, and trading access.
How to Use TradingView: Essential Features and Tools
TradingView includes several products, each answering a different market question. Supercharts is the main trading platform for price analysis. Screeners search groups of assets. Watchlists keep the symbols you follow. Calendars put scheduled events next to market moves. The Pine Editor supports custom indicators and strategies. News, community ideas, and broker profiles add context, but a published idea is someone else’s interpretation, not a trade signal. TradingView also supplies embeddable widgets for publishers, which are different from the tools inside a full account. TradingView’s Supercharts map shows where these products sit in the current interface.
A beginner doesn’t need every feature at once. One candlestick chart, two saved symbols, one price alert, and the calendar handle a normal first session. The more specialized software matters only when a question arises that a simpler view can’t answer. A stock investor might want earnings and financial data. A forex trader may care more about central-bank releases and how two currency pairs move together. A crypto trader may track an exchange-specific ticker and weekend moves.
Is TradingView Suitable for Beginners?
Yes, if the first task stays narrow. The platform lets you open an account, search for an instrument, change a timeframe, draw a level, and practice with virtual funds without writing code. Its huge library of technical indicators and community scripts can also create false precision. A beginner’s guide works best when it starts with the actual price series and adds a tool only when its purpose is clear. The free Basic plan can support that initial workflow within its limits. A charting app does not teach you how much capital to risk, and it cannot guarantee that an attractive setup will work.
Microsoft vs Apple. Bitcoin vs Gold. Nasdaq 100 vs Oil. With Versus Pairs, you decide which side comes out stronger.

TradingView Tutorial: Set Up the Platform to Use TradingView
The web platform runs in a browser. The desktop app gives you a dedicated workspace with linked tabs. The mobile app is handy for checking an alert away from your computer. Start with the browser version so the menus described here are easy to find. Sign up, open Products → Supercharts, and save a new chart layout under a descriptive name like “FX daily review.” Some charting capabilities, data feeds, historical depth, and alert limits vary by subscription or exchange agreement. Check the current plan details before relying on a particular feature.
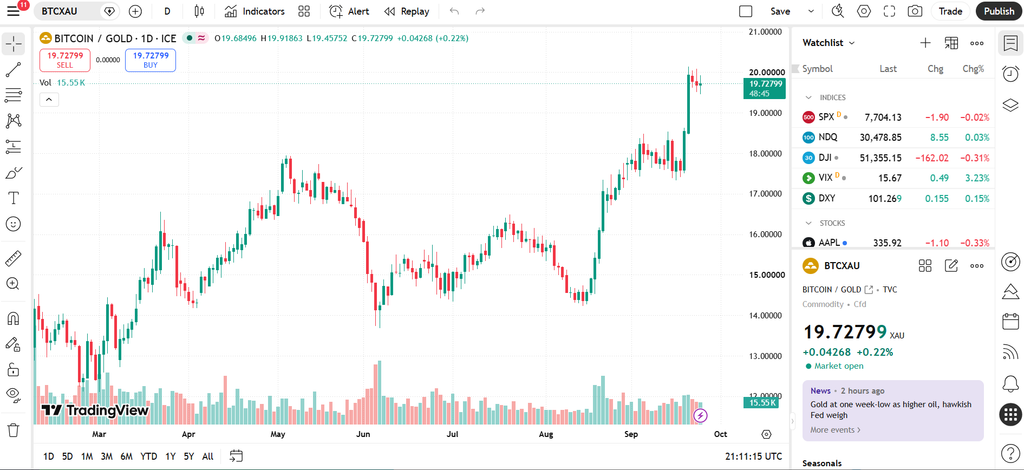
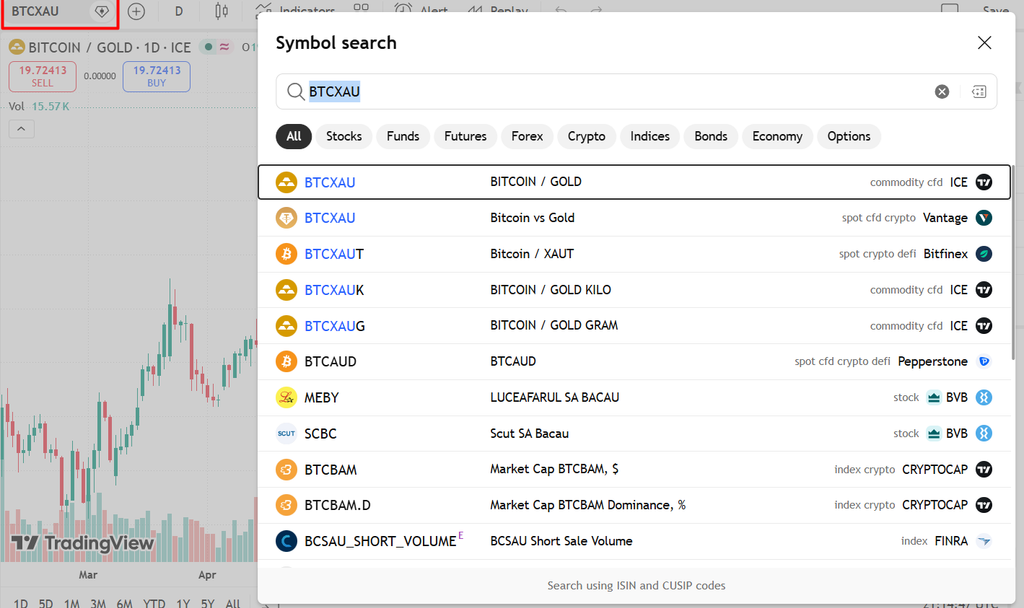
Find a Symbol Without Choosing the Wrong Market
Click the symbol field at the top left and type a ticker like USDIDR, EURUSD, or XAUUSD. Search results often include multiple exchanges and data providers for the same asset. Read the source shown next to the symbol and compare its quote with the instrument from the broker where you plan to trade. A reference currency feed and a broker’s forex CFD can differ in price, spread, trading hours, and contract terms.
For an Indonesian trader, the chart’s selected time zone also matters. Open Chart Settings → Symbol → Timezone, or click the clock at the bottom right, then select Asia/Jakarta to show chart times in WIB.
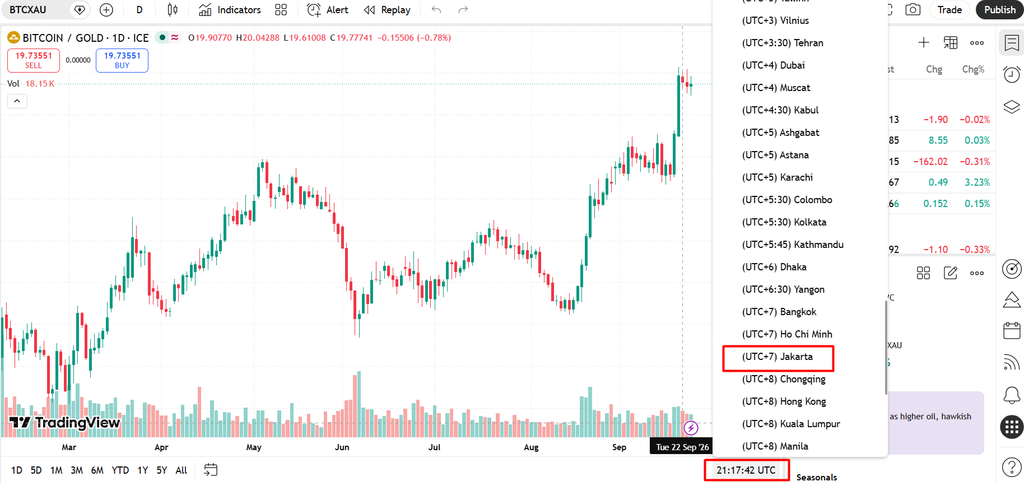
The calendar has its own time-zone filter. Alert-log times follow the operating system. Changing the chart setting does not change either of those. Check the displayed event time when tracking US announcements. Save the layout after changing the time zone and chart settings.
Read the Main Chart Controls
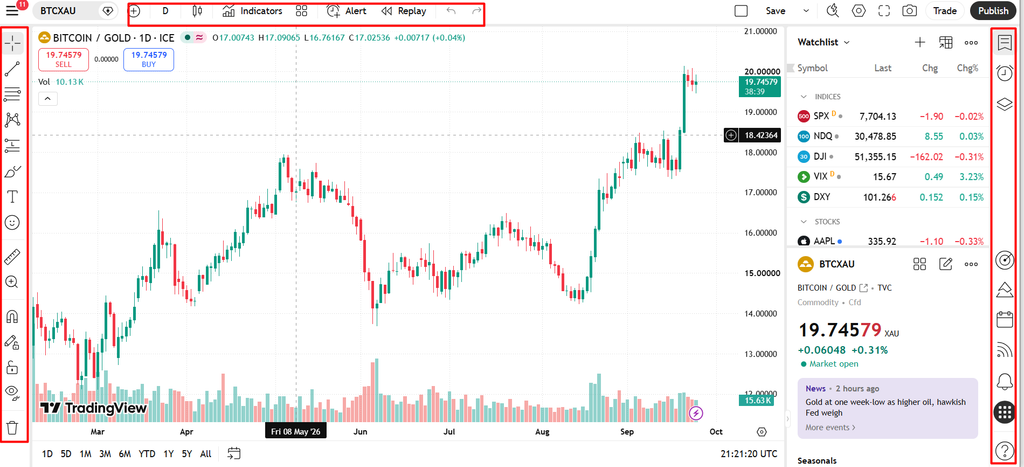
The top toolbar changes the instrument, candle interval, chart style, comparison series, and indicators. The left toolbar holds drawing tools. The right-side panels house lists, alerts, and other market information. Menus can move as TradingView updates its interface, so the label is more reliable than a fixed icon position. A five-minute bar answers a different trading question than a daily candle. Zooming a daily chart does not turn its candles into hourly data.
How to Set Up and Customize Charts on TradingView
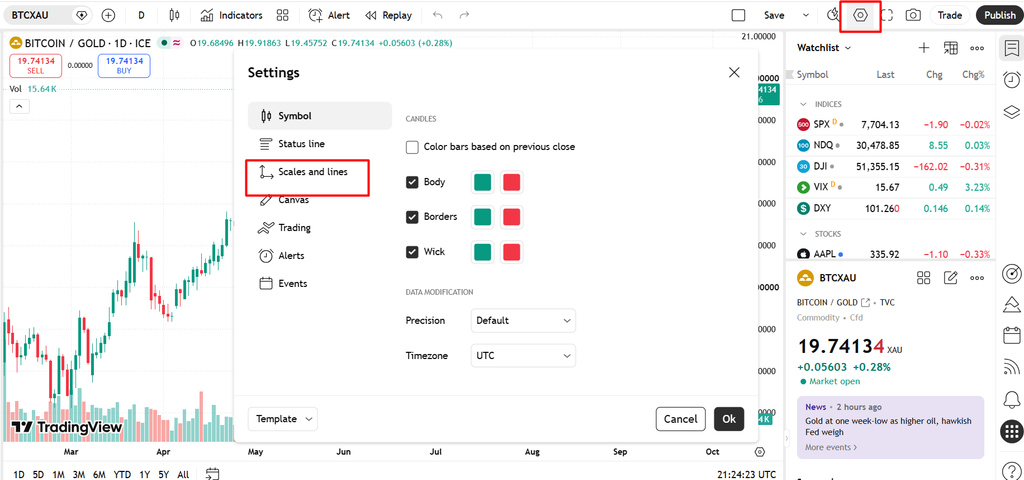
Start with the symbol and provider, then pick a chart type and timeframe from the top toolbar. Open the Settings gear to adjust candle colors, background, grid, price labels, and time zone. Under Symbol, the available controls depend on the instrument: a stock can have session and dividend-related settings that a forex pair does not. The Scales and Lines section changes how labels and the price scale appear. A clean background with a readable candle and crosshair is much more useful than a dramatic color scheme when you review several charts in a row. TradingView’s settings guide documents the separate menus.
Save the workspace from the Manage layouts menu after adding drawing tools and studies. A chart layout preserves its settings and drawings. An indicator template packages a set of studies for reuse on another chart. If the layout’s name shows Save, recent edits are still pending. Multi-chart layouts can display, for example, the daily and hourly views side by side. Symbol, interval, and crosshair synchronization are selectable rather than automatic for every element. The layout guide explains how saving and reopening work, and subscription limits determine how many charts can appear in one tab.
Chart Guide: Candles, Timeframes, and Comparisons
Candlestick charts show each interval’s open, high, low, and close. The body marks the open-to-close range. Wicks mark the extremes. A long upper wick near an earlier high can reveal rejection, but one candle cannot establish why the price moved. Line charts simplify a broad trend. Bars show the same four prices in another form. Renko organizes movement into price-based bricks, which can clarify direction but change how time and prices appear. Access to intraday Renko depends on the plan, and Renko charts do not work with Bar Replay. TradingView cautions against using nonstandard chart prices for strategy backtests. See the chart-plan comparison and Replay limitations.
An Indonesia-based trader following EUR/USD might begin with the daily view to mark a broad range, move to four hours to check the latest swing, then use one hour to study a potential entry. Changing intervals can alter the apparent trend without changing the underlying market. Note the timeframe in any saved idea or screenshot.
Click the Compare or Add symbol to place another series on the same chart.
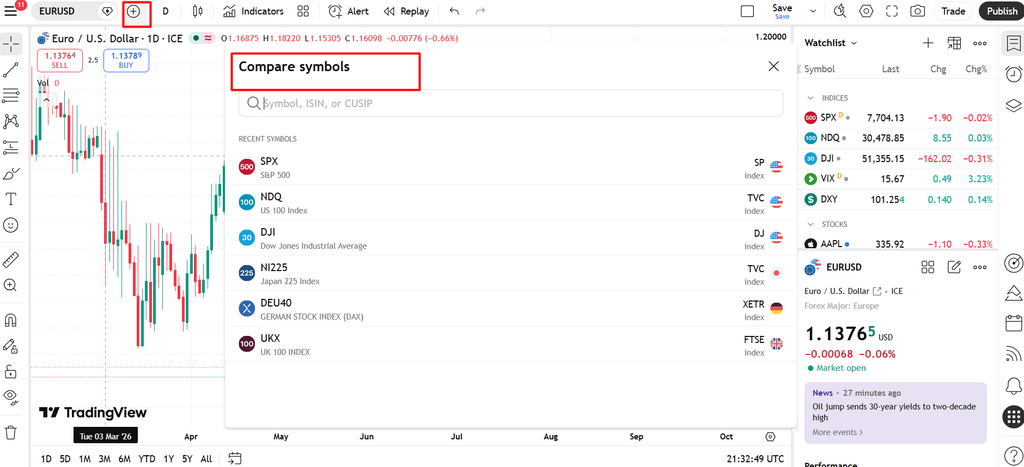
TradingView changes the shared vertical scale to percentage change, measured across the portion currently visible on screen. Zooming or panning can therefore change the displayed percentages. This makes series with different raw prices easier to inspect together.
[EUR/USD candlestick chart with daily timeframe selected, a horizontal resistance line, an upward trend line, and a comparison series displayed as percentage change. Label each element and show the provider next to both symbols.
Draw Levels and Examine Risk
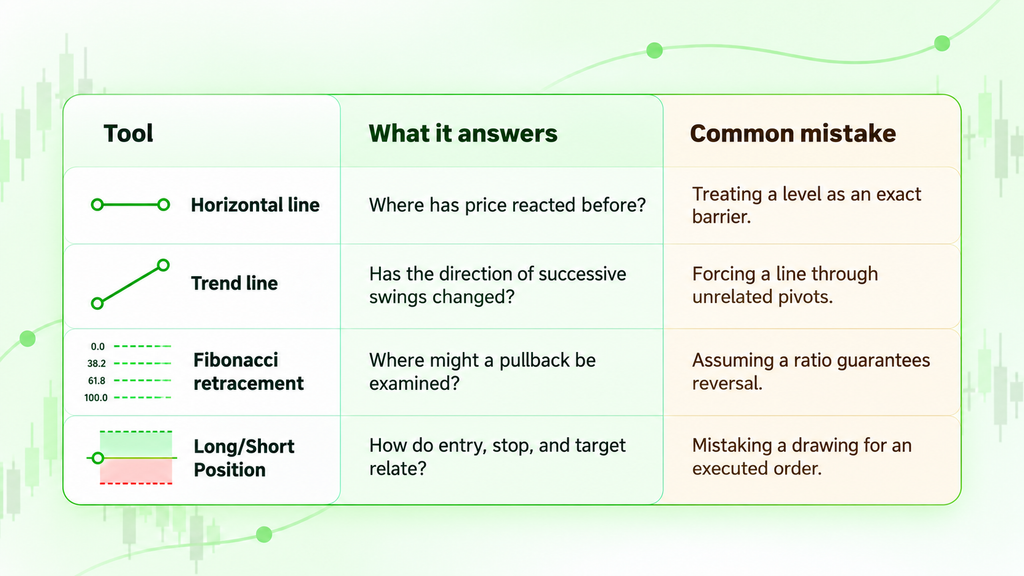
Pick a horizontal line from the left toolbar and click an earlier swing high. Add another near a repeated low. The Long Position and Short Position drawing tools let you model entry, stop, target, and reward-to-risk before placing an order. Their properties allow account size and risk inputs.
Indicator Guide: Add, Adjust, and Remove Studies
Open Indicators in the top toolbar. Search for a built-in moving average and add it to the price pane.
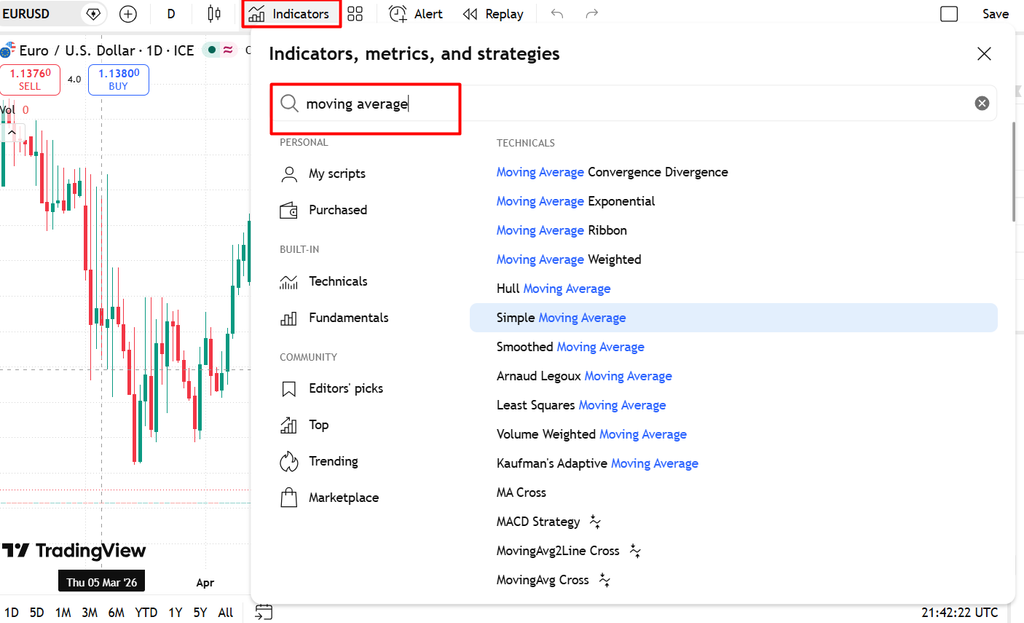
Its period controls how many candles enter the calculation, so a 20-period average on an hourly chart is not the same horizon as one on a daily chart. Two moving averages can reveal different trend horizons without predicting the next candle. Add RSI as a momentum oscillator in a separate pane. Bollinger Bands, placed over price, show its position relative to a volatility envelope. These technical indicators measure different features of the same data. Agreement between them is not independent proof of a trade.
Expand the chart legend with the arrow beneath the symbol name. Next to the indicator, click the gear icon to adjust inputs and colors, or the trash icon to remove it. If the question is how to remove indicators in bulk, TradingView also offers removal options in the left toolbar for studies, drawings, or both. Save an indicator template if you want the same studies on another symbol. TradingView illustrates the legend controls here.
Technical analyst and creator of Bollinger Bands—John Bollinger.
Source: Bollinger Bands rules.
“High” here is relative to the bands. A candle touching an upper band can keep moving upward during a strong trend. Bollinger’s published rules explicitly discuss that possibility, so a touch alone is a weak sell signal.
[One EUR/USD chart with Bollinger Bands on price and RSI in the lower pane, which fits Basic’s two-indicator limit. Show the expanded indicator legend, gear icon, and trash icon; annotate what a band touch does and does not indicate. A separate moving average would count as a third indicator.]
Build an Alert That Matches the Idea
Right-click at a price level and choose Add alert, or open the alert dialog from the chart. Set a precise condition, such as EUR/USD crossing above a chosen level, then review trigger frequency, expiration, and notification channel. A basic price-series alert is independent of the chart interval. An alert tied to an indicator, strategy, or drawing can depend on its timeframe. Chart time-zone settings do not alter alert timestamps. If indicator parameters change after an alert is created, TradingView says the existing alert keeps the original settings. Edit or recreate it if the signal has changed. TradingView explains the interval distinction.
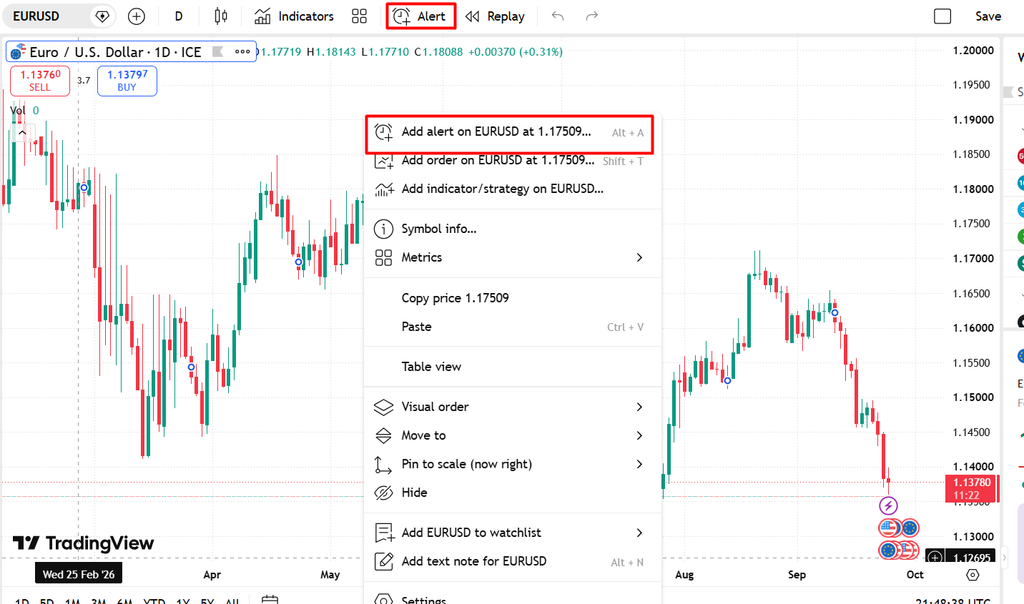
A practical alert log can include the symbol, data provider, interval, condition, and the reason the level matters. When an alert arrives, check its time against the calendar and the latest candle. The extra record helps distinguish a planned setup from a notification triggered by a brief price spike. The chart can clarify a setup, but market execution introduces spread, slippage, and position sizing. Traders who want to move from drawing a setup to observing actual platform mechanics can use practice trading with Versus Trade on its demo environment. Virtual results do not establish what a live position will earn.
Try strategies, explore MT5 and get a feel for the markets with a demo account before putting real capital on the line.
Tools for the market: watchlist, screener, and the economic calendar
A watchlist puts the symbols you follow one click away. Open the right panel and add the instruments you want to track.
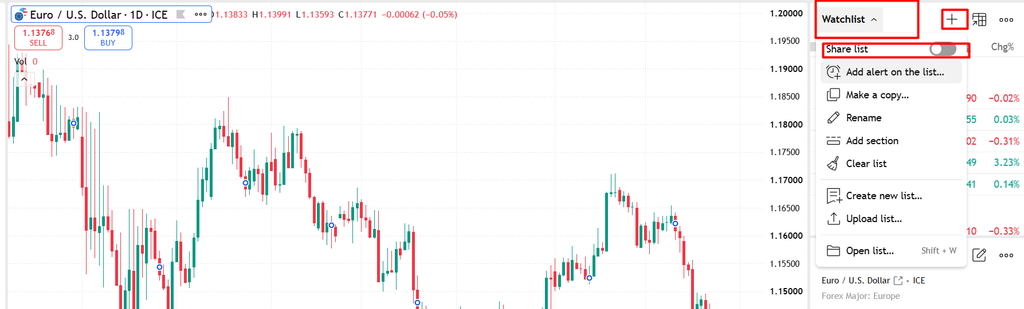
Inside a single list, sections let you keep unrelated assets apart, so you can put USD/IDR and major dollar pairs in one group and commodities or indices in another. The number of separate lists depends on your plan: Basic allows one. Advanced view offers grouping and more market-data columns; ordinary watchlist columns can be shown or hidden from the three-dot menu.
A screener begins with a wide set of tickers and narrows them down. For the current Stock and Crypto Coins Screeners, open Products → Screeners or the screener menu within Supercharts. TradingView also has a separate Forex Screener; its controls may differ from the newer screeners.
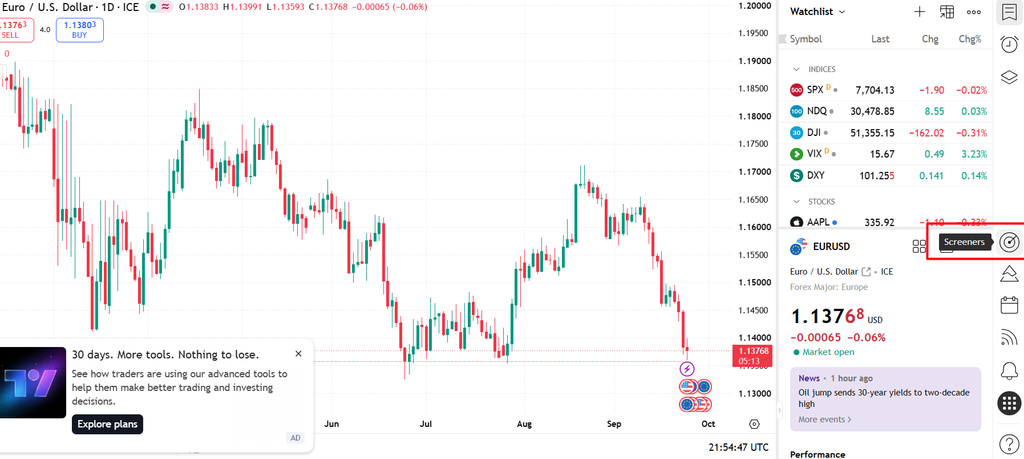
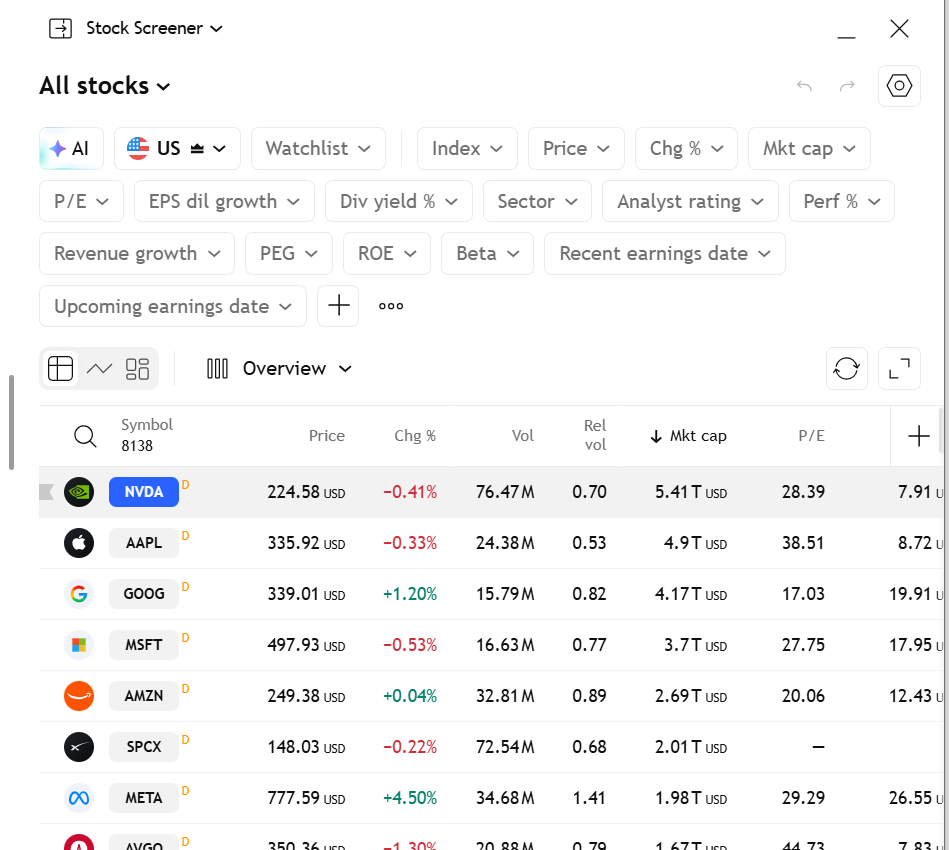
Set the available filters and examine the results. Volume or volatility data can help assess market activity, but a screener cannot establish the live liquidity, spread, execution costs, or availability of a particular CFD at your broker. Review each relevant symbol and add suitable results to your watchlist when that screener supports the action.
The economic calendar gives event context to technical setups. You can filter the full calendar by country, importance, category, period, and time zone, then check the scheduled time, previous figure, forecast, and actual release when it appears. Bank Indonesia decisions can move rupiah pairs, while US inflation and Federal Reserve announcements often affect dollar markets.
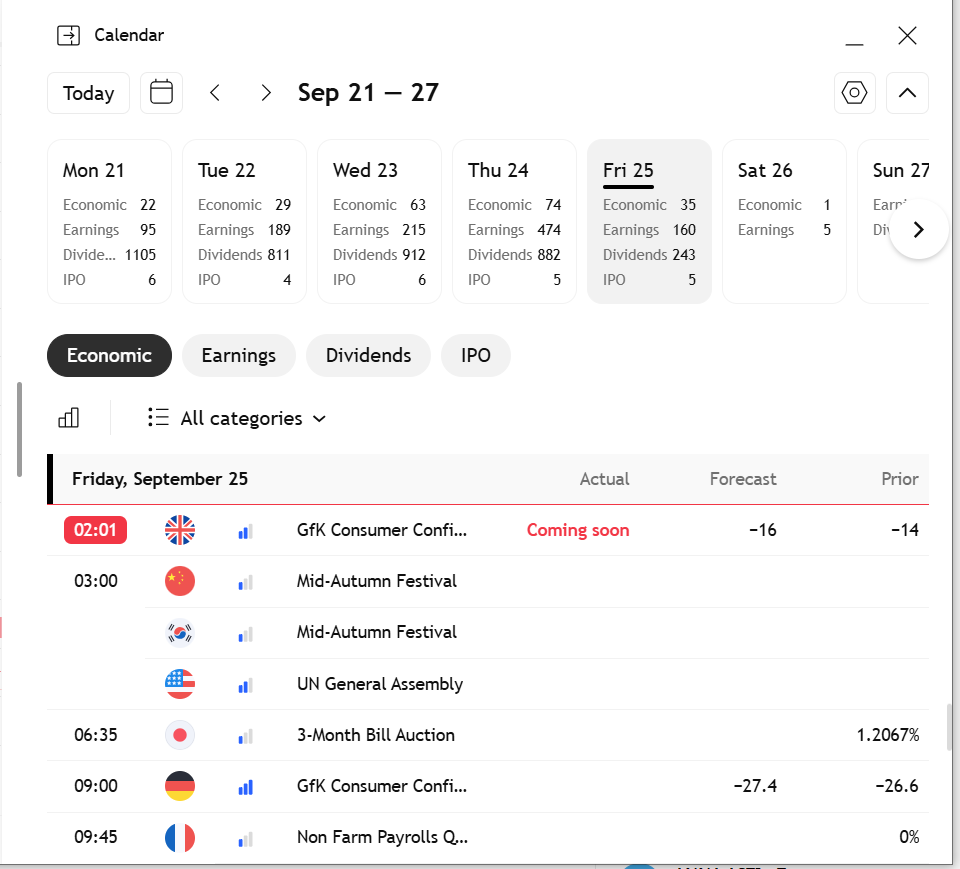
A forecast is only an estimate, and the actual release can push prices either way. TradingView’s economic calendar connects with Supercharts as well.
What TradingView widgets do
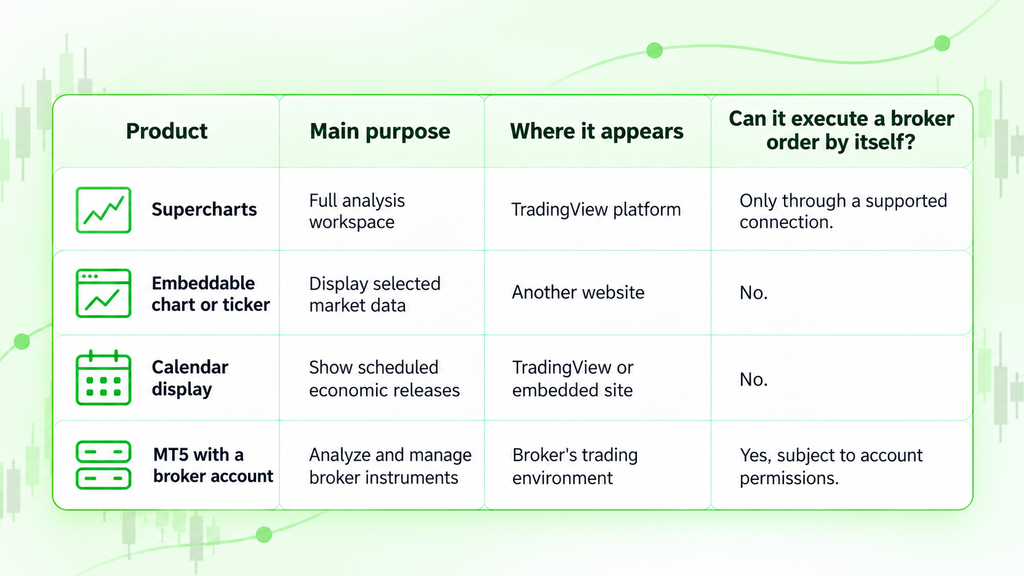
An embeddable widget places a compact TradingView data view on another website. The directory contains charts, tickers, market overviews, screeners, and calendar displays. A site owner picks a tool, adjusts its settings, and copies the embed code so visitors can see a market picture without opening a full TradingView workspace. Publishers need to verify data coverage, branding, and terms. An embedded view does not include brokerage execution or every Supercharts feature.
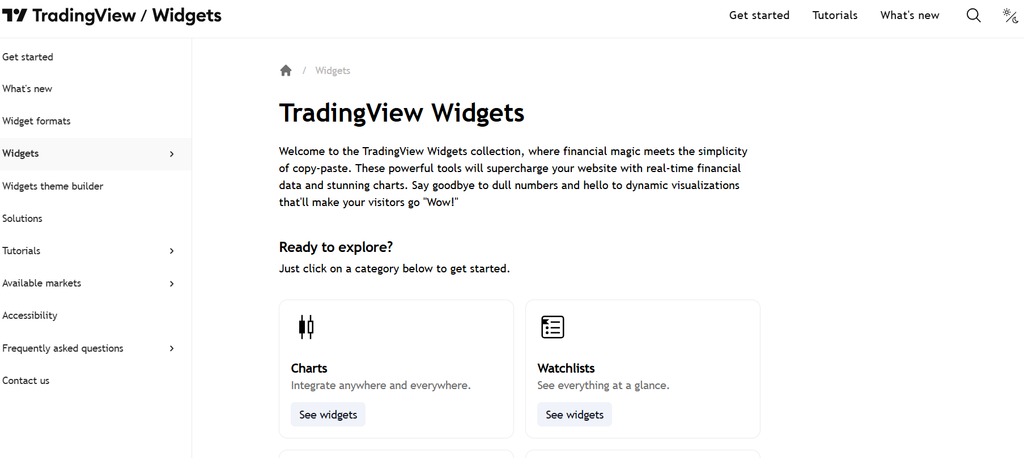
For a publisher, the right widget depends on the page. A ticker tape shows several quotes at once, a symbol overview gives one instrument more space, and a calendar fits an article about upcoming macro releases. TradingView’s widget directory has configuration examples and embedding instructions. Even if the display looks like a live trading screen, the data source and any exchange delay still matter.
How to use TradingView effectively?
A repeatable workflow assigns one job to each feature. A trader scanning forex might begin with a short list of instruments, run the appropriate market screener to spot unusual moves, and then open a TradingView chart to see whether the price broke a range you marked earlier. The economic calendar tells you if a scheduled release is coming up. Drawing tools record your invalidation level, and an alert watches for the actual trigger. This order of steps keeps you from treating the first RSI crossover or candlestick pattern as a full strategy. When it is time to look at a tradable contract, a trader using Versus Trade can take that analysis to the separately available broker platform.
The quality of any analysis also depends on the symbol you pick. Your chart provider might display a reference price while the executable broker order uses its own bid and ask. That difference can be largest around thin liquidity and news. Record the symbol source, interval, time zone, and reason for each alert, plus the eventual outcome. When you compare stocks, an index, a fund, or a crypto pair, confirm that each series has similar trading hours and that you are using percentage change for the comparison. A chart crowded with overlays can hide the exact move you wanted to study.
Keep research, simulation, and execution distinct
TradingView offers research, charting, social publications, virtual trading, and direct orders with some integrated brokers. If you are an investor reading a community post, you still need to check the market, date, and assumptions behind it. A simulated position has no real-money profit or loss. A live order needs an eligible brokerage account and the terms of the selected instrument. TradingView’s trading guide puts broker choice and the order ticket after you prepare your chart.
Strategy tutorial: test an idea before placing an order
Three separate activities sit under this heading. Bar Replay hides candles that come after the point you choose, so you can study a past market one bar at a time. Replay Trading, a different mode, lets you place simulated orders on historical data, but those trades and results disappear after the session ends. Paper trading uses a virtual account against current market data, and you connect it through the Trade control. TradingView treats historical replay orders differently from ordinary paper and broker orders, which keep using real-time prices even while the chart is in replay. Bar Replay can save your viewing position for a later session, but it does not save the transaction record from Replay Trading. TradingView documents historical replay orders and the replay session in separate help pages.
Run a manual replay
- Pick a symbol, timeframe, and past starting point on Supercharts.
- Click Replay in the upper toolbar and choose the candle where you want to begin.
- Step forward through candles without peeking ahead, writing down your planned entry, invalidation point, and exit.
- Go through several market periods, including calm ranges and sharp moves.
If you want to learn how to backtest a rules-based system, add a strategy from Indicators → Strategies and look at the strategy report below the chart.
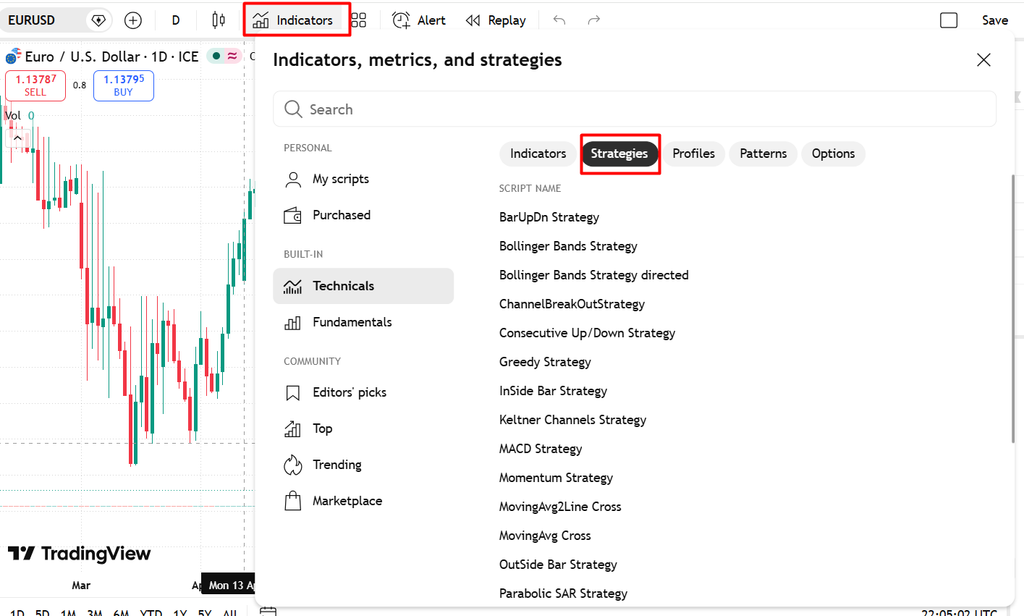
An ordinary indicator does not need to contain trade rules. Custom strategies are written in Pine Script and simulate orders through TradingView’s broker emulator.
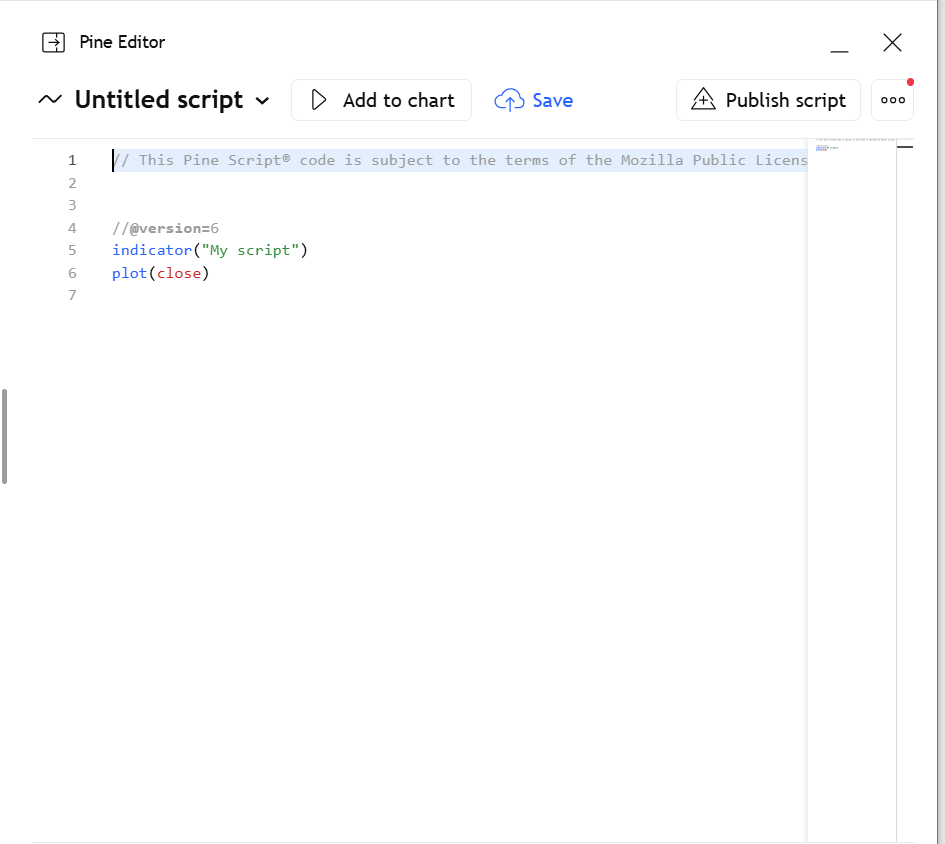
Commission, slippage, data range, and chart type can significantly change the report. Past performance does not guarantee future results.
That observation matches the testing process. An attractive community script is a starting hypothesis, not a strategy that you have independently validated. Check its assumptions and the markets where it was tested. Community scripts include indicators and strategies, and a pretty equity curve can come from parameter choices that fit one historical sample.
[A strategy on a conventional candlestick chart with the strategy report visible below. Mark the test period, simulated trades, drawdown, and settings for costs. Avoid presenting an illustrative result as a return forecast.]
The difference between free and paid TradingView plans
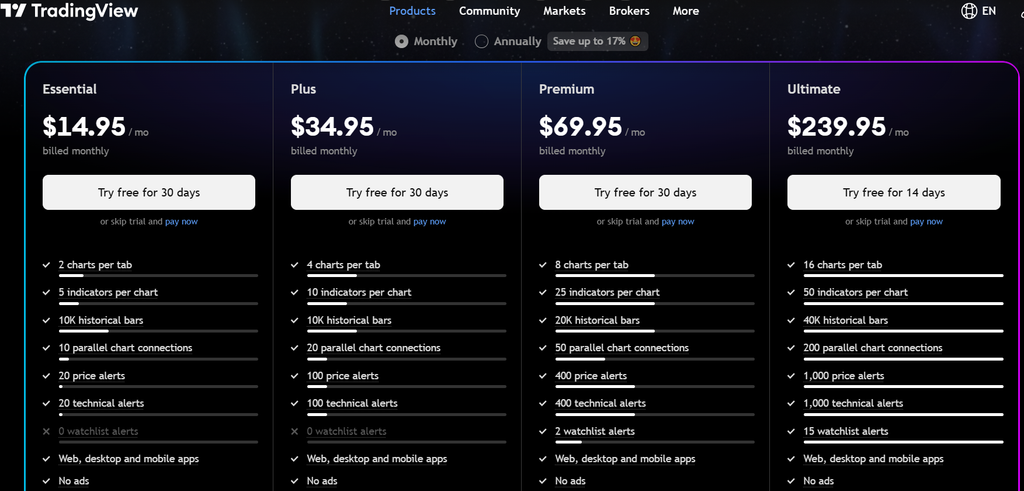
The Basic plan gives you an entry point for charts and indicators. Essential, Plus, Premium, and Ultimate increase capacity and add more tools. On TradingView’s current comparison page, Basic allows one chart per tab and two indicators per chart. Essential allows two charts and five indicators, Plus allows four and ten, Premium allows eight and 25, and Ultimate allows 16 and 50. The same page shows larger price-alert allowances as you move up the plans. These premium plans expand what the platform can handle, but they are not a prediction of trading profits, and the published limits can change.
Basic can be enough to learn chart basics, follow a modest number of symbols, draw support and resistance, and try a simple strategy. An upgrade matters more when you keep hitting the limit on simultaneous charts, active alerts, indicators, or historical bars. Premium and higher plans offer Deep Backtesting across the historical data TradingView has for the selected symbol, subject to data and calculation limits. Features that rely on exchange data might need a separate market-data subscription even if you pay for a plan. Pay attention to the chart’s “Data is delayed” label and the exchange or provider shown next to the symbol before you pay for an upgrade. TradingView explains separate exchange-data purchases in its help center.
The desktop app gives you a way to organize a workspace within the TradingView platform, but it is not a replacement for a paid plan. An investor who only uses a daily candle and one moving average will gain little from a larger subscription. Someone monitoring multiple forex pairs, chart layouts, and technical alerts has a much clearer reason to compare plans. In either case, the executable quote comes from your connected broker, and paying TradingView for exchange data does not change what appears in that broker’s order panel. TradingView describes this data distinction in a separate help article.
Brokers and execution: from TradingView analysis to MT5
TradingView includes a trading panel for supported brokers and a built-in simulation account. Click Trade on a chart, look at the available providers, and connect only through a provider that is actually listed for your account and region. Order types and available instruments depend on that connection. Do not assume that a broker offering MetaTrader 5 also accepts TradingView orders. TradingView’s own help pages describe MT4 and MT5 accounts for some providers that cannot trade through its interface.
The documented Versus Trade environment centers on MT5. A trader can analyze on TradingView and then find the matching instrument in the broker’s terminal. Before sending an order, check the exact contract specification, quote, volume unit, spread, stop distance, margin, and trading hours. Chart symbols from different providers do not always map one-to-one to broker CFDs. The Forex broker page at Versus Trade describes currency trading and MetaTrader access, but it does not establish a direct TradingView integration. The same distinction matters when you look for broker forex services.
An example workflow useful for CFD traders
Imagine a trader sees EUR/USD testing an earlier range high. The TradingView chart supplies the price structure, a marked level, an alert, and the schedule of US events. The separate broker ticket determines whether the instrument is available, how much a position represents, and what execution costs apply. For example, you might mark the range high on the daily chart, look at the hourly candles, and set a price crossing alert. That price alert watches the level no matter which chart interval you have open. If the alert fires minutes before a major US release, the economic calendar gives you a reason to revisit the setup. You can compare the TradingView quote with the broker’s live bid and ask, calculate exposure from the actual contract size, and note whether your proposed stop fits the broker’s minimum distance. Higher leverage can allow a larger position for the same margin, increasing potential gains and losses if you use that capacity, but it does not improve a chart signal. A demo order on the broker platform can show whether your planned stop and volume match that broker’s contract rules.
Can you earn money directly through TradingView?
An ordinary TradingView account does not earn money when you open a chart, publish an idea, or get a positive result in a simulated account. A trader can analyze a market and, where a supported broker connection is available, place a real order. Any resulting gain or loss belongs to that brokerage position. TradingView’s trading guide separates the charting workflow from broker execution. The simulated fills from a Pine strategy and the balance shown in paper trading cannot be withdrawn as trading profit. Separately, eligible authors accepted into TradingView’s Creator Program can earn through subscriptions to Paid Spaces containing their scripts. Admission requires review, and publishing a script or an idea does not create a payout.
At Versus Trade, the analysis-to-execution route described here is to find the matching broker instrument on MetaTrader 5, check its contract specifications, and place the order there if your account allows it. The broker’s instrument list, spreads, margin rules, and applicable leverage determine the position’s conditions. A TradingView premium plan or a chart pattern does not change those terms.
When your account connects to an integrated broker on TradingView, the trading panel may let you place trades, inspect open orders, and close positions from the interface. The available controls depend on that broker. Traders using a separate MT5 account work through the broker’s own terminal instead. The same visible chart pattern can produce different transaction costs because bid and ask prices, spreads, and commissions come from the executable market. That difference matters even if the selected strategy has been tested thoroughly: a historical fill from an emulator does not prove that a live market order will get the same price. For an Indonesian trader watching a US release overnight, checking the broker quote at the moment of the alert matters more than adding another indicator to an already crowded chart.
Readers who want to introduce clients to brokerage services can review the Forex Affiliate program at Versus Trade. Its partner terms are separate from TradingView’s charting features.
- How to Use TradingView: Essential Features and Tools
- TradingView Tutorial: Set Up the Platform to Use TradingView
- Chart Guide: Candles, Timeframes, and Comparisons
- Indicator Guide: Add, Adjust, and Remove Studies
- Tools for the market: watchlist, screener, and the economic calendar
- How to use TradingView effectively?
- Strategy tutorial: test an idea before placing an order
- The difference between free and paid TradingView plans
- Brokers and execution: from TradingView analysis to MT5