
ICT trading strategies Explained: A Comprehensive Guide for Beginners


- Key ICT Concept Terms Every Trader Must Understand
- Essential ICT models for Day Trading
- ICT killzone Dynamics for Malaysian Traders
- Is ICT a Good Trading Strategy?
- Which Is the Best ICT Trading Strategy?
- What Is the 3-5-7 Rule in Trading?
- What Is the ICT Power of Three?
- What Are the Advantages and Limitations of ICT Trading?
- How to learn ICT trading: A Step-by-Step Roadmap for Beginners
- Malaysian Market Realities, Regulation, and Platform Choice
- Modern Execution: AI Text Tools and Advanced Infrastructure
Inner Circle Trader (ICT) is a technical-analysis methodology that interprets market structure shifts, liquidity sweeps, and price imbalances as potential trading signals. Unlike approaches that use support and resistance as fixed historical levels, the ICT approach treats clusters of highs, lows, and stop orders as potential liquidity areas and tracks how price behaves around them. Its explanations of algorithmic price delivery and institutional behavior are elements of the ICT framework rather than independently verified descriptions of how the interbank market operates.
Understanding this framework is the foundation of ICT trading strategies, a system developed by Michael J. Huddleston (widely recognized as the Inner Circle Trader). The methodology is intended to give traders a structured way to time entries around market structure and potential liquidity zones, replacing or supplementing conventional indicators with its own rules for interpreting price action, time-based trading windows, and fair value gaps.
For retail traders modernizing their online trading workflows, learning these ICT trading concepts offers a systematic approach to reading market structure alongside smart money concepts.
Head of Payments, Versus Trade — Olga Khylko
In markets such as Malaysia, traders may access FX pairs (USD/MYR, EUR/USD, GBP/USD) and instruments linked to gold (XAUUSD). Bank Negara Malaysia administers Malaysia’s foreign-exchange policy, while the Securities Commission Malaysia regulates relevant capital-market products and intermediaries; these frameworks do not endorse ICT or any particular trading strategy. Whether using automated tools or manual analysis on a modern trading platform, deploying a best-in-class ICT trading framework offers a structured process for chart reading.
Key ICT Concept Terms Every Trader Must Understand
ICT theory proposes an Interbank Price Delivery Algorithm (IPDA) as a conceptual model in which price moves between external liquidity areas (retail stop clusters) and internal price imbalances. Traders should not confuse this model with a publicly documented algorithm used across the interbank market.
Mastering these key ICT trading principles requires understanding four fundamental concepts:
| ICT Concept | Visual Identifier on Chart | Conceptual Meaning |
| Market Structure Shift (MSS) | A strong displacement candle closing beyond a key swing high/low. | Interpreted as a potential signal that directional order flow may reverse. |
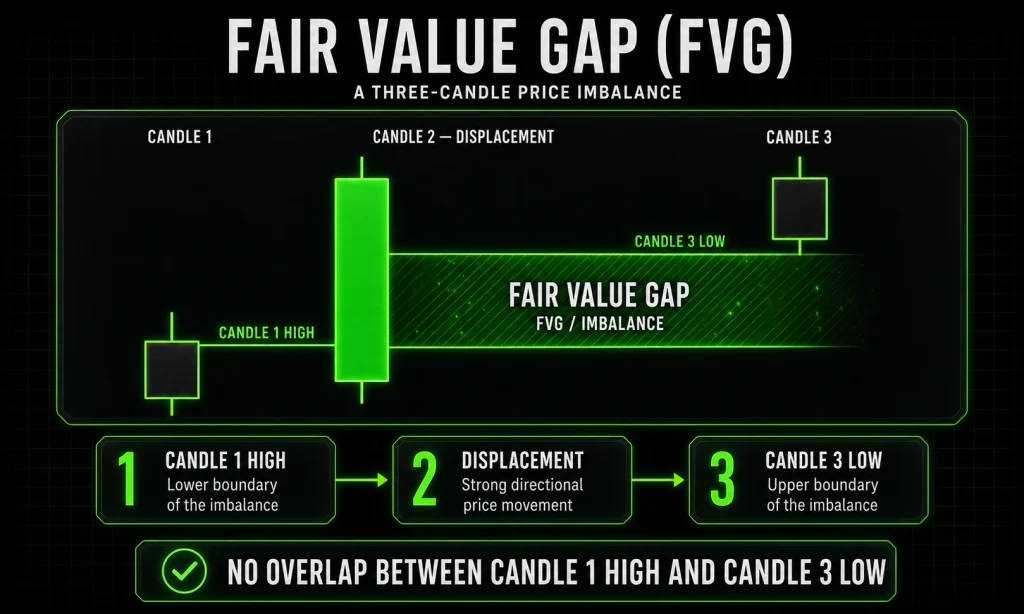
| Fair Value Gap (FVG) | A three-candle pattern in which the first and third candle ranges, including their wicks, do not overlap across a specific price interval. | Represents a price imbalance or inefficiency that traders watch for potential rebalancing. |
| Order Block | A candle or price area prior to a strong impulsive move. | Interpreted as a possible origin of strong buying or selling. |
| Liquidity Pool | Equal highs (EQH) or equal lows (EQL) above/below price. | An area where ICT traders expect stop and breakout orders to cluster and watch for a possible price sweep. |
Understanding market structure shift (MSS) and Break of Structure (BOS)
The foundation of any ICT strategy relies on mapping structural shifts accurately. In a classic uptrend, the market forms a series of higher highs and higher lows. Conversely, a downtrend forms lower lows and lower highs. Conversely, a downtrend forms a lower low followed by lower highs. A prior swing high may act as a resistance zone, while a prior swing low may serve as support, although neither area guarantees a reversal.
A Break of Structure (BOS) occurs when price continues in the direction of the prevailing trend, breaking previous key levels to signal continuation. However, when price aggressively breaks a significant swing low during an uptrend (or a swing high during a downtrend) with heavy displacement, it signals a market structure shift.
Within ICT analysis, this shift is interpreted as a possible change in directional order flow and may be used to identify opposing liquidity as a potential target. The price pattern alone cannot establish what institutional participants are doing. Analysis software like TrendSpider enables traders to mark these structural shifts across multiple timeframes easily.
Fair Value Gap (FVG) and Liquidity Pool Dynamics
In a bullish three-candle sequence, an FVG (or fair value gap) is identified when the high of the first candle remains below the low of the third candle. In a bearish sequence, it appears when the low of the first candle remains above the high of the third candle, leaving a gap between consecutive candlesticks that marks a price imbalance.
ICT practitioners watch for possible retracements into these areas, although an FVG may remain partly or completely unfilled and does not guarantee continuation or a return to a balanced price range.
A liquidity pool refers to price areas where stop-loss orders may concentrate. Visible support and resistance zones—such as double tops or double bottoms—may attract trading activity because stop and breakout orders can cluster around them. A liquidity sweep does not by itself prove deliberate stop hunting or predict a reversal.
Order Block and Breaker Block: Structural Reference Points
In ICT terminology, an order block is a candle or price area interpreted as a possible origin of strong buying or selling before a displacement move. Candlestick data alone cannot confirm that institutions accumulated positions there, nor does a bullish order block guarantee future support.
When an order block fails to hold price and breaks impulsively, ICT traders reclassify it as a breaker block. ICT traders may treat a breaker block as a potential point of interest (POI) when the price returns to the failed level. The retest may produce a reaction, but neither a sharp rejection nor high-probability ICT setups for intraday trading are guaranteed.
Essential ICT models for Day Trading
Applying ICT trading concepts effectively requires turning theoretical knowledge into repeatable, rule-based ICT models. These models combine time, price, and market structure to establish clear discretionary entry mechanics.
As highlighted in our fintech industry analysis, Why Some People Grow Fast in Fintech — And Others Burn Out Just As Fast, structured systems and emotional discipline can support more consistent decision-making, although they do not ensure long-term trading performance.
The Silver Bullet Strategy
The ICT silver bullet strategy is a structured trading approach. The bullet strategy is a time-based framework operating within specific 60-minute windows based on New York local time.
The commonly cited silver bullet windows (New York local time) are:
- AM Session: 10:00 AM – 11:00 AM
- PM Session: 2:00 PM – 3:00 PM
- London Open: 3:00 AM – 4:00 AM
During these designated windows, the trader watches for a potential liquidity sweep of a prior high or low, followed by an MSS that leaves an FVG. Entry is considered inside the imbalance, with targets set toward opposing liquidity zones.
Optimal Trade Entries (OTE) Model
The Optimal Trade Entry (OTE) model uses a Fibonacci retracement tool with ICT-specific retracement levels to map pullbacks within a defined price swing.
- Identify a market structure shift accompanied by displacement.
- Anchor the Fibonacci retracement tool from the swing low to the swing high of the move (for a long setup).
- Focus on the OTE zone between the 0.62, 0.705, and 0.79 retracement levels.
- Observe whether the OTE zone aligns with an unmitigated order block or fair value gap.
- Define an entry near the 0.705 level with a stop loss placed beyond the invalidation swing low, targeting the previous higher high.
Testing execution mechanics without capital risk is an essential step for beginners. A demo trading account allows beginners to practise OTE entries and Silver Bullet windows using simulated execution, often with prices derived from current market feeds. It does not reproduce all live-account conditions, including slippage, liquidity constraints, and execution differences.
ICT killzone Dynamics for Malaysian Traders
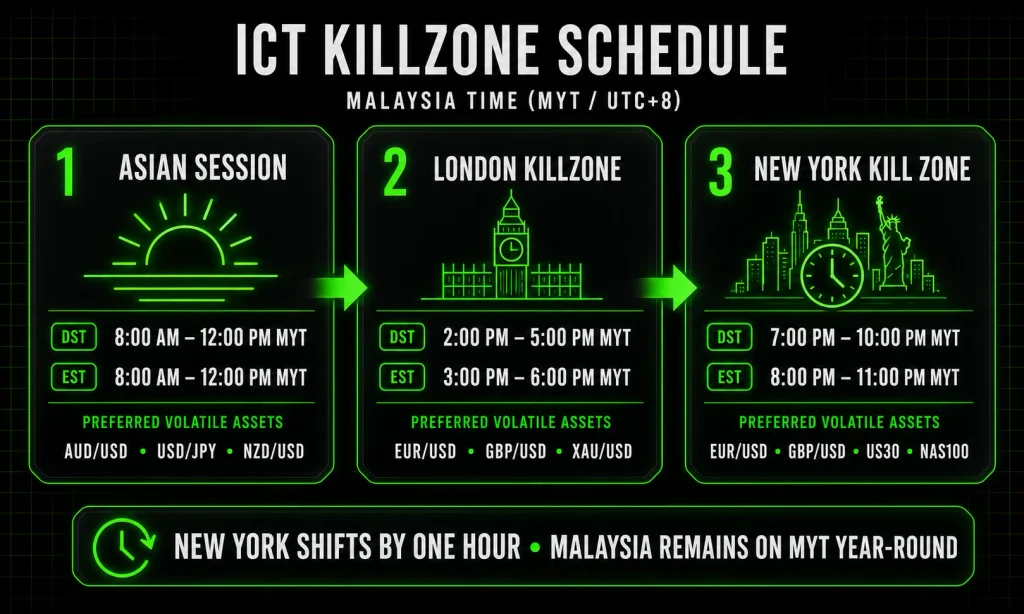
In the ICT methodology, time windows are used to filter market activity. Price volatility tends to concentrate during specific sessions known as ICT killzones. Each of these trading sessions has distinct liquidity and volatility characteristics that may influence how ICT setups develop.
Because New York observes Daylight Saving Time (EDT) while Malaysia remains on MYT (UTC+8) year-round, London and New York killzone times in MYT change by one hour when New York enters or leaves daylight saving time.
Chairman and CEO, Berkshire Hathaway — Warren Buffett.
For Yahoo Finance, June 20, 2019.
Malaysian traders analyzing the New York kill zone during evening hours should adjust their charts for seasonal daylight saving shifts to ensure their ICT forex strategy aligns with true New York local execution windows.
Is ICT a Good Trading Strategy?
ICT can provide a structured framework for technical analysis, but its effectiveness varies by trader, market, and implementation. There is no broadly accepted independent evidence that ICT consistently outperforms other technical-analysis methods or provides a guaranteed edge. While it trains traders to focus on market structure and liquidity areas rather than static support and resistance levels, trading outcomes depend entirely on risk management, market conditions, and disciplined execution.
Which Is the Best ICT Trading Strategy?
OTE and Silver Bullet are two commonly discussed ICT models, but no single ICT setup has been demonstrated to be the best choice for most day traders. The OTE model uses a fair value gap and ICT-specific levels plotted with a Fibonacci retracement tool, including 0.705, following a market structure shift. Restricting trades to specific windows like the new york kill zone reduces the number of eligible setups, but it does not necessarily increase the win rate or produce a favorable risk-to-reward outcome.
What Is the 3-5-7 Rule in Trading?
The 3-5-7 rule commonly refers to a retail risk-management guideline rather than a sequence of three pushes, five Elliott waves, and seven trading periods. Interpretations vary by source, but the numbers are generally used to set limits for risk per trade (e.g., 3%), combined exposure across open positions (e.g., 5%), and a profit or reward objective (e.g., 7%). It is not a formally established ICT market-cycle model, and these percentages should not be treated as universal market laws.
What Is the ICT Power of Three?
The ICT Power of Three (AMD) is a conceptual model used to interpret how a daily or session range may develop. The acronym stands for:
- Accumulation: Price consolidates in a relatively tight range during early session hours.
- Manipulation: Within ICT terminology, price briefly moves outside the accumulation range in what ICT traders interpret as a false breakout or liquidity sweep.
- Distribution: Price then expands away from the range in the direction identified by the trader.
These labels describe the ICT model and do not prove intentional manipulation or the existence of a predetermined “true” target.
Every pip counts. Trade with paper-thin spreads built to keep more of every market move in your hands.

What Are the Advantages and Limitations of ICT Trading?
Evaluating both the strengths and constraints of the ICT framework is essential for any trader operating within the ICT community.
Advantages
- Structured Rules: Offers an alternative to lagging indicators by focusing on price action and time windows.
- Defined Risk Parameters: Entering inside an unmitigated price imbalance allows traders to establish clear invalidation points for a stop loss.
- Market Context: Provides practical terminology for categorizing market structure, liquidity sweeps, and price swings.
Limitations
- Steep Learning Curve: Mastering concepts like FVG, MSS, BOS, OB, and breaker blocks requires extensive chart study.
- Subjective Interpretation: Lower timeframes contain noise; pattern recognition remains discretionary and open to trader bias.
- Requires Patience: Some intraday ICT models, including Silver Bullet, restrict entries to specific time windows, requiring traders to wait for conditions to align.
How to learn ICT trading: A Step-by-Step Roadmap for Beginners
Learning the ICT framework requires a methodical approach to chart analysis rather than attempting to trade live immediately. Following a structured course of self-study helps build observational discipline.
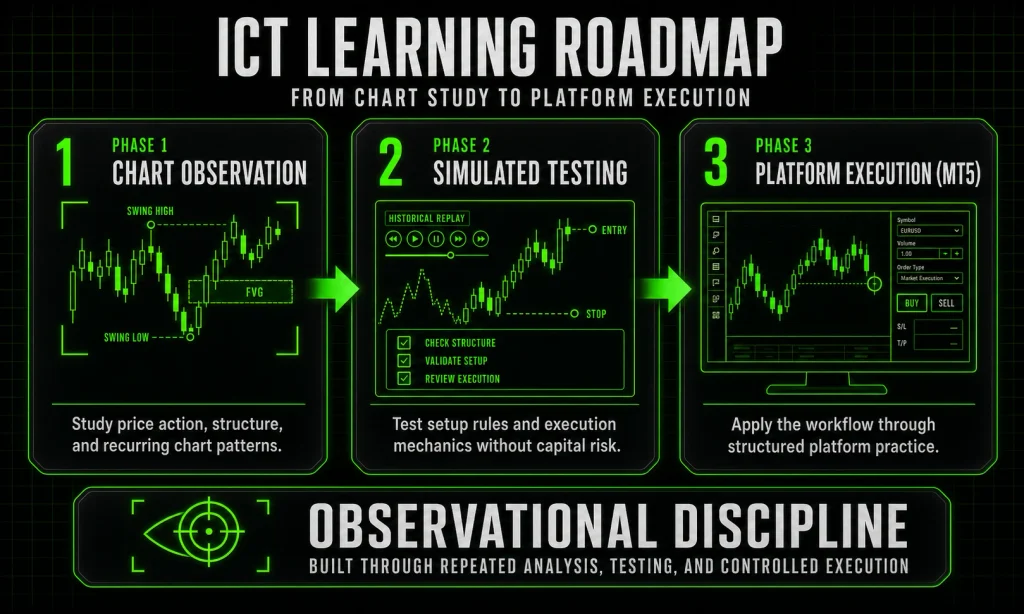
Phase 1: Mastering the ICT Trading Methodology and Chart Observation
Begin by training your eyes to identify structural patterns on clean charts.
- Study Pure Price Action: Observe candlestick charts without relying on secondary mathematical indicators.
- Identify Imbalances: Practice marking every fair value gap and observing how price behaves upon returning to the area.
- Map Higher Timeframe Structure: Mark swing highs and swing lows on higher timeframes to establish context.
Phase 2: Testing Strategies on MetaTrader 5
When you can identify setups visually, transition to testing execution mechanics on a technical trading platform. MetaTrader 5 for Windows provides multi-timeframe charting and order-management tools to use the ICT framework effectively. Actual execution speed depends on the broker’s infrastructure, server location, network latency, liquidity, and market conditions. Downloading MetaTrader 5 for Windows grants access to these workstation tools.
Avoid these common beginner mistakes when evaluating ICT setups:
- Overtrading Outside Windows: Taking trades during low-volume hours when price moves without clear direction.
- Trading Against Higher Context: Taking short entries during an established higher-timeframe uptrend.
- Misplacing Stops: Setting stop-loss orders inside an open FVG rather than beyond the structural invalidation point.
- Expecting Guaranteed Reactions: Treating the ICT method as a predictive system rather than a probabilistic trading methodology.
Malaysian Market Realities, Regulation, and Platform Choice
Traders residing in Malaysia must evaluate market providers against local regulations. Bank Negara Malaysia administers Malaysia’s foreign-exchange policy, while the Securities Commission Malaysia regulates relevant capital-market products and intermediaries.
Malaysian traders should verify a provider’s regulatory status and applicable client protections. Access to FPX or claims about segregated funds does not by itself establish that a broker is authorized in Malaysia or protected by Malaysian regulators.
| Conventional Technical Analysis | ICT Trading Concepts |
| May incorporate market sessions, volume patterns, or time-based filters. | Treats swing points as potential liquidity zones. |
| Uses mathematical indicators (RSI, Moving Averages). | Focuses on price action, timing windows, and structural shifts. |
| Enters on traditional pattern breakouts. | Watches for pullbacks into a price imbalance following liquidity sweeps. |
| May use static historical levels as support and resistance levels. | Some intraday models restrict entries to designated ICT killzone windows. |
Adopting a structured key ICT observational model helps traders maintain consistency while respecting strict risk management protocols.
Modern Execution: AI Text Tools and Advanced Infrastructure
Traders frequently combine manual analysis with technical scripting and AI text charting tools. Modern charting scripts can automatically highlight a fair value gap, locate a breaker block, or plot OTE Fibonacci levels across your charts.
Before executing a trade setup, review this operational checklist:
- Is the price currently inside an active ICT kill zone window?
- Has higher-timeframe market liquidity (session high/low or equal highs/lows) been cleared?
- Has a market structure shift occurred with displacement on lower timeframes (1m–5m)?
- Is there an unmitigated fair value gap or order block available as a reference point?
- Is your risk-to-reward ratio structured around a logical stop-loss placement?
Combining structured analysis with reliable trading infrastructure provides the technical groundwork for analyzing global financial markets.
Start Your Trading Journey with Versus Trade
Ready to test institutional price concepts on a professional platform? Apply the concepts of the ICT methodology using transparent trading tools on a reliable infrastructure. Open a live or demo account with Versus Trade today to analyze FX, metals, and indices on MT5.
Try strategies, explore MT5 and get a feel for the markets with a demo account before putting real capital on the line.
- Key ICT Concept Terms Every Trader Must Understand
- Essential ICT models for Day Trading
- ICT killzone Dynamics for Malaysian Traders
- Is ICT a Good Trading Strategy?
- Which Is the Best ICT Trading Strategy?
- What Is the 3-5-7 Rule in Trading?
- What Is the ICT Power of Three?
- What Are the Advantages and Limitations of ICT Trading?
- How to learn ICT trading: A Step-by-Step Roadmap for Beginners
- Malaysian Market Realities, Regulation, and Platform Choice
- Modern Execution: AI Text Tools and Advanced Infrastructure