
Swing Trading Strategies That Work: The Practical Indonesian Guide


- Why Swing Trading Fits the Indonesian Market Reality
- Core Concepts Behind the Best Swing Examples
- Top Entry Strategies and Technical Toolkits
- Risk Management Across Stocks and Crypto
- Indonesia’s Regulatory Framework and Practical Market Steps
- Why These Strategies That Work Support Profitable Swing Trading
A Jakarta office worker notices a clean pullback on a daily chart during the evening, places an order with a defined stop, and reviews it after the next session. That rhythm captures the appeal of a swing trade. It seeks a meaningful part of a short-term move without demanding that someone watch every tick.
The swing trading strategies that work often look almost boring on paper: a defined trend, a clear entry, controlled position size, and an exit decided in advance.
A trader may apply them to an IDX stock, a major forex pair, or liquid crypto, but the logic remains consistent: identify an imbalance, wait for confirmation, and keep the loss small when the idea fails.
HR Business Partner, Versus Trade — Karina Matkovska
That observation also fits trading. A written plan matters, but behaviour under pressure reveals whether the process is real. This guide turns that process into entry rules, chart examples, and controls that can fit around an Indonesian trader’s full-time job.
Why Swing Trading Fits the Indonesian Market Reality
Indonesia spans three time zones, while Bursa Efek Indonesia operates on Jakarta time. The regular market runs in two weekday sessions, with a midday break, according to the Indonesia Stock Exchange trading schedule. Someone working standard office hours may miss much of that window. A multi-session position is often easier to manage because the analysis can happen after the close and orders can be planned in advance.
The same schedule creates a practical distinction between active speculation and investment. Day trading concentrates decisions inside one session. A longer-term investor may hold an asset through several business cycles. Swing trading sits between them, usually targeting price movements that develop over several days or weeks.
| Approach | Typical holding period | Monitoring load | Main decision |
| Intraday trading | Minutes to one session | High | Whether immediate order flow supports the move |
| Swing approach | Several days to a few weeks | Moderate | Whether a multi-session market trend remains intact |
| Long-term investing | Months to years | Low | Whether the business or asset thesis is strengthening |
Local retail traders also look beyond domestic shares. Major currency pairs and global indices can move after the IDX close, while digital assets trade continuously. Access to online CFD trading may broaden the available instruments, although CFDs can involve leverage and overnight financing costs and counterparty exposure. They do not provide ownership of the underlying share. The usual framing of trading vs. investing can obscure a more useful question: how long can the trader realistically monitor and finance the exposure?
This flexibility does not make every market equally suitable. Thin liquidity can widen spreads, and an overseas event can produce a gap before an IDX order executes. The practical advantage lies in choosing a timeframe that leaves enough room for analysis without turning each evening into another shift.
What Is Swing Trading, and How Does It Differ From Day Trading?
Swing trading holds a position across several sessions to capture a wider move. Day traders normally close before the session ends. The difference is mainly holding time and monitoring intensity.
Benefits and Risks of Swing Trading
Its main benefit is flexibility: decisions can be planned outside market hours. The trade-off is overnight and weekend exposure. Gaps can bypass a stop, financing can accumulate, and correlated positions may lose together. Fewer screen hours do not mean lower risk.
Core Concepts Behind the Best Swing Examples
Useful analysis begins with context, not an indicator. A bullish candle means little if it appears directly below a major resistance zone. The same candle can carry more information after a controlled pullback within an uptrend.
A swing trader studies how price behaves across more than one timeframe. The weekly or daily chart establishes trend direction. A four-hour or one-hour view can refine the entry point. This top-down method reduces the chance of treating ordinary noise as a reversal.
A chart review can be reduced to four decisions:
- Start with the longer-term chart and mark whether highs and lows are rising, falling, or moving sideways.
- Draw the nearest support level and resistance level from visible reactions, not from a single isolated wick.
- Review volume and price data for evidence that participation expands with the intended move.
- Define the trigger, invalidation price, and target before the order reaches the market.
The weekly and daily windows reveal the broad structure. A four-hour chart shows a developing pullback, range, or breakout, while the one-hour view can refine order timing. This popular trading approach keeps the lower-timeframe decision connected to the larger move.
The goal is alignment. Suppose an IDX share has made higher lows for six weeks, pulls back for 10 days, and stabilises near its average price over the past month. A daily close above the pullback’s high may provide a usable signal. If the broader chart is falling, the identical shape has weaker odds because the trader is buying against prevailing pressure. Capital kept outside a weak setup remains available to invest when conditions improve.
Market price also needs room to travel. A technically clean entry just below overhead supply may offer poor reward relative to risk. The most useful setups combine structure, space, and a clear point where the original idea becomes wrong.
Try strategies, explore MT5 and get a feel for the markets with a demo account before putting real capital on the line.

What Timeframes and Charts Do Swing Traders Use?
Daily candlestick charts are the common working view. Weekly charts provide direction, while four-hour or one-hour charts refine the trigger. Volume, support zones, and moving averages add context.
How Do You Find Stocks for Swing Trading?
A stock scanner can narrow the IDX universe by liquidity, turnover, volatility, relative strength, and proximity to a multi-week high or moving average. The resulting watchlist still needs manual review. Adequate volume, a readable daily structure, a nearby invalidation point, and enough space to the next resistance matter more than the number of scanner matches.
Top Entry Strategies and Technical Toolkits
Strong entry strategies do not predict exactly when the market turns. They define observable conditions that justify exposure. Technical analysis can help organise those conditions, especially when several tools point to the same conclusion.
A pattern is stronger when:
- The setup follows an established directional move rather than random sideways action;
- The trigger closes beyond a relevant price level with expanding participation;
- The stop sits beyond structural invalidation, not at an arbitrary cash amount;
- The projected gain is meaningfully larger than the planned loss.
The surrounding business process matters as well. Versus Trade’s LinkedIn article, Not All Traffic Is Equal: What High-Performing IBs Do Differently, discusses how quality and behaviour matter more than raw activity. The parallel for traders is useful: more signals do not automatically produce better decisions. Selectivity often carries more value than frequency.
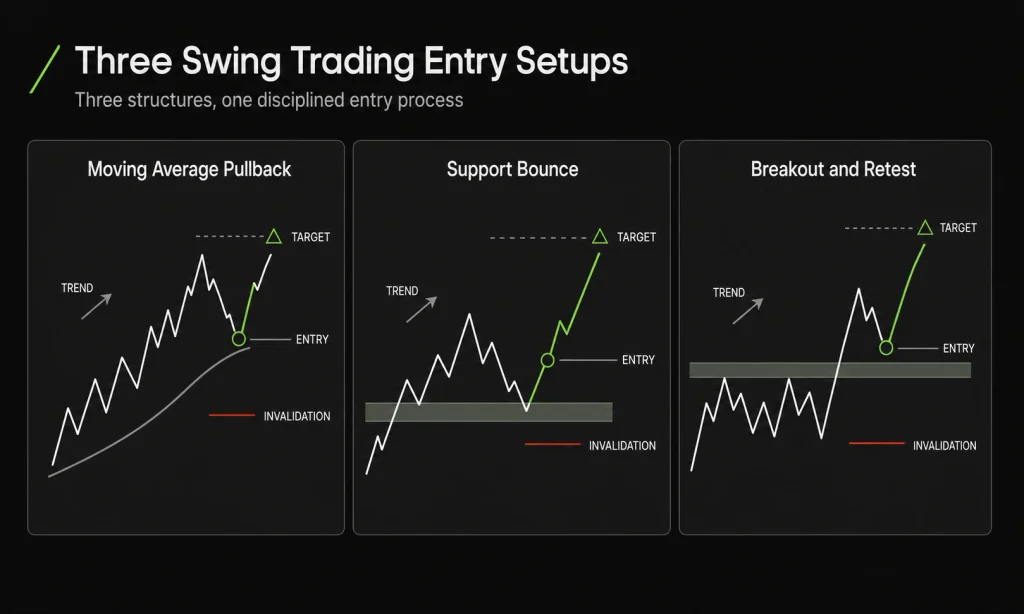
Using a Moving Average Crossover for Timing
A 20-day moving average reacts faster to recent changes, while a 50-day line reflects a slower baseline. When the faster line moves above the slower one, the cross may confirm improving momentum. It works better as a filter than as a stand-alone command.
Consider a liquid share that closes above both averages after a three-week consolidation. If the faster line is rising and volume-weighted participation expands on the advance, a pullback toward the faster average may offer a more controlled entry than buying the first surge. The invalidation can sit below the consolidation low or another structural reference.
A moving average is derived from past prices, so the crossover lags. In a sideways range, repeated crosses can generate several losing signals. Price action and the slope of both lines help distinguish a developing bullish trend from mechanical noise.
Momentum Confirmation Without Indicator Stacking
Relative strength index and MACD can confirm acceleration, but adding more tools does not necessarily add information. RSI holding above its midline during a pullback may support a bullish reading. A MACD recovery can show that downside momentum is fading. When both are derived from the same underlying price series, agreement should not be mistaken for independent evidence.
Support and Resistance Breakout Setups
A breakout becomes interesting when the price closes beyond an area that rejected several earlier attempts. The resistance level then has a chance to become support. A trader can enter on the close, wait for a retest, or place a conditional order above the trigger candle. Each choice trades speed for confirmation.
Imagine a cryptocurrency ranging between IDR 1.45 million and IDR 1.60 million. A brief move above the ceiling that returns inside the range is not confirmation. A close above it, followed by a low-volume retest and a decisive bounce, provides a cleaner structure. The failed level offers a logical exit if the price closes back below it.
Pullback Entries After a Confirmed Break
Chasing a large candle often leaves a wide stop and weak reward-to-risk ratio. A retracement toward the broken area may improve the average price, although the market may continue without offering a second entry. The setup disappears if the retest breaks deeply into the former range. Waiting has value only while the original breakout remains valid.
Risk Management Across Stocks and Crypto
A strong setup can still lose. Risk control keeps one ordinary loss from becoming a portfolio event. This matters particularly in cryptocurrency, where weekend trading, sharp liquidations, and thin order books can move prices while many traditional markets are closed.
Impact Competition Foundation Founder — Lance Breitstein
52-Minute Risk Management Masterclass from a $100,000,000 Trader, July 15, 2026.
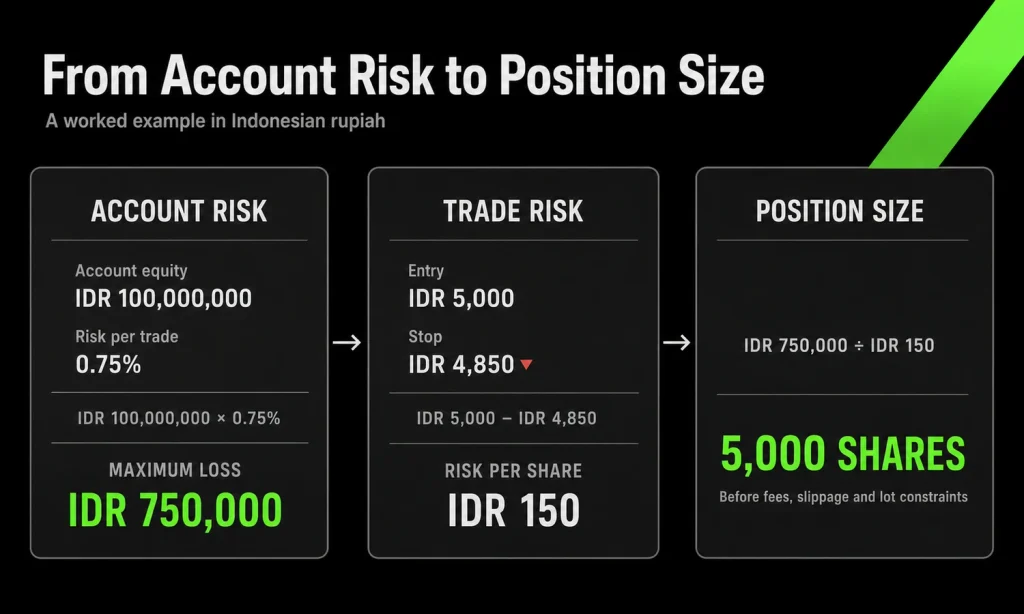
The arithmetic begins before entry. If account equity is IDR 100 million and the maximum risk is 0.75%, the loss budget is IDR 750,000. With an entry at IDR 5,000 and a stop at IDR 4,850, risk per share is IDR 150. The theoretical size is 5,000 shares before fees, slippage, lot constraints, and any currency conversion are considered.
| Control | Stocks and index products | Bitcoin and other digital assets |
| Position risk | Fixed fraction of equity, adjusted for gaps | Smaller fraction when volatility expands |
| Stop reference | Structure, volatility, or closing-price rule | Structure plus allowance for continuous trading |
| Leverage | Financing and overnight gaps affect exposure | Liquidation risk can exceed the apparent stop risk |
| Exit plan | Scale-out or target near prior supply | Limit orders may reduce slippage in fast conditions |
A broker promotion should never determine trade size. A 100 deposit bonus may change available margin under its terms, but it does not change downside risk, market volatility, or the distance to invalidation. Margin efficiency and capital safety are different questions.
Can You Make $100 a Day Swing Trading?
It is possible on some days, but no account can reliably produce a fixed $100 every day. Returns arrive unevenly, and some sessions offer no valid trade. On a $5,000 account, $100 equals 2% a day before costs, an aggressive target that can encourage excessive leverage. Process and risk-adjusted results are more useful measures than a daily cash quota.
What Is the 3-5-7 Rule in Stocks?
One widely circulated version limits risk to 3% on a single trade and 5% across all open positions, then uses 7% as a profit objective. Other interpretations assign a different meaning to the final figure, so the rule is better treated as a flexible template than an industry standard.
Explore Versus Trade’s market tools and practise the setup with predefined entry, stop, and target levels before committing live capital.
Managing Open Positions and Exit Strategies
Traders can hold positions while the original structure remains valid, not merely because a loss feels temporary. A swing trader would look for continued higher lows in a rising market, stable momentum, and no decisive close through the invalidation point.
Entry and exit points should come from the same thesis. If a pullback entry depends on support holding, a close below that support challenges the idea. Moving a stop farther away changes the planned trade and increases risk without new evidence. A trailing stop can protect profit after a move develops, but tightening it too early can turn normal volatility into an unnecessary exit.
Fibonacci Retracement in Volatile Markets
Fibonacci levels describe proportions, not physical barriers. Traders commonly watch 38.2% and 61.8% of a prior advance to locate possible pullback zones. The Fibonacci sequence explains how those ratios are derived, but the chart does not have to respect them.
Suppose an asset rises from 100 to 150. A 38.2 retracement level sits near 130.9, while 61.8 lies near 119.1. If the deeper zone overlaps prior support and momentum begins to recover, the confluence may be useful. Without a rejection candle, improving volume, or another form of confirmation, the line alone is not a trade.
Indonesia’s Regulatory Framework and Practical Market Steps
Indonesia’s oversight map changed materially in 2025. Regulation and supervision of digital financial assets, including crypto assets, transferred from Bappebti to OJK on 10 January 2025. OJK now publishes licensing information for digital-asset providers under POJK 27/2024, as amended by POJK 23/2025. OJK’s official licensing page is the relevant current reference.
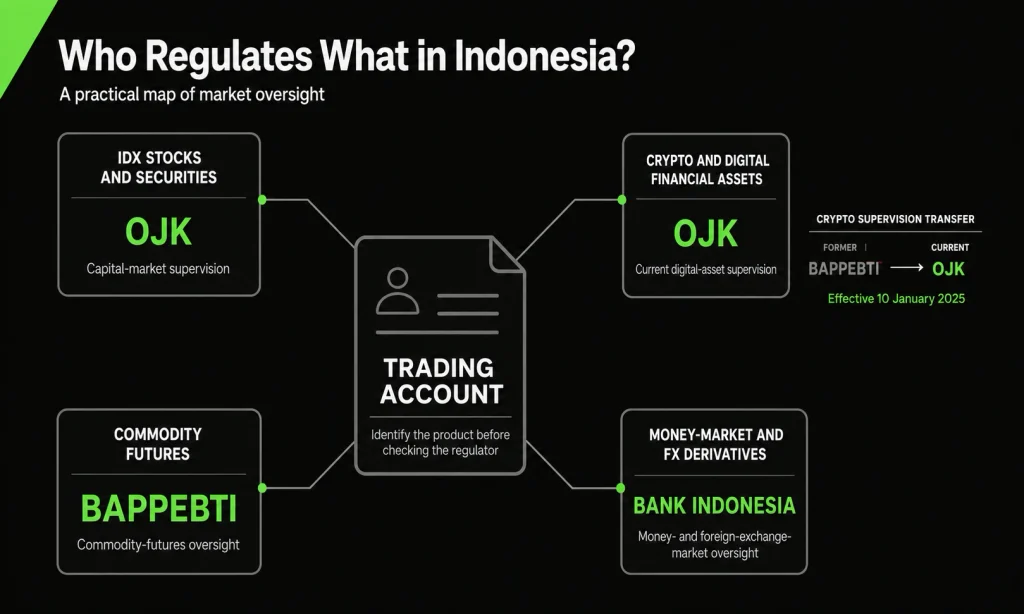
OJK also oversees the capital market. Bappebti remains relevant to commodity futures intermediaries, while Bank Indonesia supervises derivatives with money-market and foreign-exchange underlyings after the transition. The product matters as much as the brand name because a stock account, a crypto account, and a leveraged derivative account do not carry identical rights or protections.
| Activity | Main Indonesian authority | Practical verification |
| IDX securities dealing | OJK and market institutions, including IDX | Confirm the securities company and product authorization. |
| Digital financial asset trading | OJK | Use OJK’s current list of licensed providers |
| Commodity futures brokerage | Bappebti | Check the broker in Bappebti’s legal-entity database |
| Money-market and FX derivatives | Bank Indonesia | Confirm the provider and the exact regulated activity |
Account checks are practical, not ceremonial:
- the legal entity, regulator, and licence scope are visible and match official records;
- fees, spreads, overnight financing, withdrawal rules, and bonus conditions are disclosed;
- client-fund arrangements and complaint channels are stated in clear language;
- IDR conversion, market hours, and order execution fit the intended strategy.
Regulation cannot remove trading loss. It can clarify who operates the platform, which authority handles the activity, and what information must be disclosed. An investor still faces volatility, leverage, technology failure, and the possibility that market conditions differ from historical data.
Why These Strategies That Work Support Profitable Swing Trading
For someone trading after work, the process needs to remain manageable. The weekly or daily chart supplies the direction, while the lower timeframe helps sharpen the entry. Once the order is placed, the stop and position size matter more than finding another indicator.
The strongest process is usually compact enough to repeat after work: mark structure, wait for confirmation, calculate risk, place the order, and record the result. A bullish signal inside a broad downtrend deserves less trust than the same signal inside a healthy advance. A profitable month also deserves scrutiny if one oversized gain concealed several uncontrolled losses.
Some weeks produce nothing worth taking. A range may be too tight, a breakout may arrive without volume, or the remaining upside may not justify the stop. Leaving those trades alone preserves capital for a cleaner move.
Put the framework into practice with Versus Trade and test each rule across different assets and market conditions before increasing exposure.
Keep your strategy running beyond the trading day with swap-free conditions, including dedicated Islamic account options.
- Why Swing Trading Fits the Indonesian Market Reality
- Core Concepts Behind the Best Swing Examples
- Top Entry Strategies and Technical Toolkits
- Risk Management Across Stocks and Crypto
- Indonesia’s Regulatory Framework and Practical Market Steps
- Why These Strategies That Work Support Profitable Swing Trading