Nasdaq 100 vs Crude Oil is a Versus Pair, one tradable instrument built by Versus Trade that puts US big tech against the oil market. Two forces that often pull in opposite directions, packed into one CFD you can Buy or Sell. Tech runs on growth and stable interest rates. Oil runs on supply and demand, and the oil price feeds inflation. When they split, the pair moves. One instrument, one trade, only at Versus Trade.
What is Nasdaq 100 vs Crude Oil?
Under the hood, a Versus Pair is one CFD that holds two assets at once. Nasdaq 100 vs Crude Oil sets the Nasdaq 100 as the base asset and WTI crude oil as the quote asset. You trade the Nasdaq 100’s value relative to WTI crude oil rather than its standalone level. Buy the pair when you expect the index to climb more, in percentage terms, than crude oil. Sell it when you expect crude oil to outrun the index.
This is an instrument you trade, with its own price and its own symbol on MetaTrader 5: the US100 vs WTI. Some traders type the shorthand US100 vs WTI, and some search crude oil vs Nasdaq 100 with the names flipped. The instrument stays the same. Backing oil over tech is the Sell side of the same pair, so there is no separate oil-first symbol.
Why trade Nasdaq 100 vs Crude Oil instead of US100 or WTI?
Trading US100 on its own is a bet on where US tech goes against the dollar. Trading WTI on its own is a bet on where oil goes against the dollar. Both are single-direction calls: one asset, one price line, up or down. The pair asks a different question: “Which of the two climbs faster?” Its price responds to that gap, so your position rides the performance difference between tech and oil rather than the raw move of either one.
That gap is the whole point. To express the same view without the pair, a trader would open two positions, long one asset and short the other, size them to match, and manage margin on both legs. This pair carries that relative view in one order, on one instrument. Versus Trade built it in-house, and no other broker sells it. The trade cuts both ways: gearing and a widening gap can move against you as easily as for you, so the side you pick expresses a view and carries no guarantee.
How the pair’s price moves
The price of the pair is one number: the Nasdaq 100 index level divided by the WTI crude oil price per barrel. If the index sits near 24,000 and WTI near $70 per barrel, the pair prints around 343. What pushes that number up or down is the percentage gap between the two. Point moves and dollar moves on their own do not set the direction. The relative percentage performance does.
Here is the logic, with hypothetical figures for illustration only. Say, on a strong session, the Nasdaq 100 gains 2% while crude oil gains 0.5%. The pair rises because the base grew faster in percentage terms. Now flip the day: a supply shock lifts crude oil 4% while tech slips 1%. The pair falls sharply because the quote outran the base and the two moved apart. When both legs move by the same percentage in the same direction, the pair barely budges, even when the individual point and dollar moves look large. Profit or loss is calculated in the quote asset first, then shown in your account currency.
Microsoft vs Apple. Bitcoin vs Gold. Nasdaq 100 vs Oil. With Versus Pairs, you decide which side comes out stronger.

Versus Pair Calculation
A versus pair is calculated as the price of the first instrument divided by the price of the second instrument:
Pair Value = Instrument A Price ÷ Instrument B Price
Example:
N100 = 20,000
WTI = 80
N100/WTI = 20,000 ÷ 80 = 250
If N100 decreases by 1% and WTI increases by 4%:
- N100: 20,000 → 19,800
- WTI: 80 → 83.20
- New pair: 19,800 ÷ 83.20 = 237.98
Therefore, the pair decreases by approximately 4.81%, rather than exactly 5%, because the percentage changes are applied to each instrument’s price before calculating the new ratio.
Nasdaq 100 vs Crude Oil: the two sides
Every Versus Pair carries a story, and this one is the split between the growth economy and the resource economy. On one side is the Nasdaq 100, the tech-heavy US equity index that traders follow as US100 or NDX, home to the largest software and chip names. It tends to rise when growth is strong and rates are stable, and it can fall quickly when rate fears return. On the other side is WTI crude oil, the barrel price that traders track as the crude oil price. Oil answers to supply cuts and demand swings, along with geopolitics, and its moves can be sharp and sudden, which is where crude oil volatility earns its name.
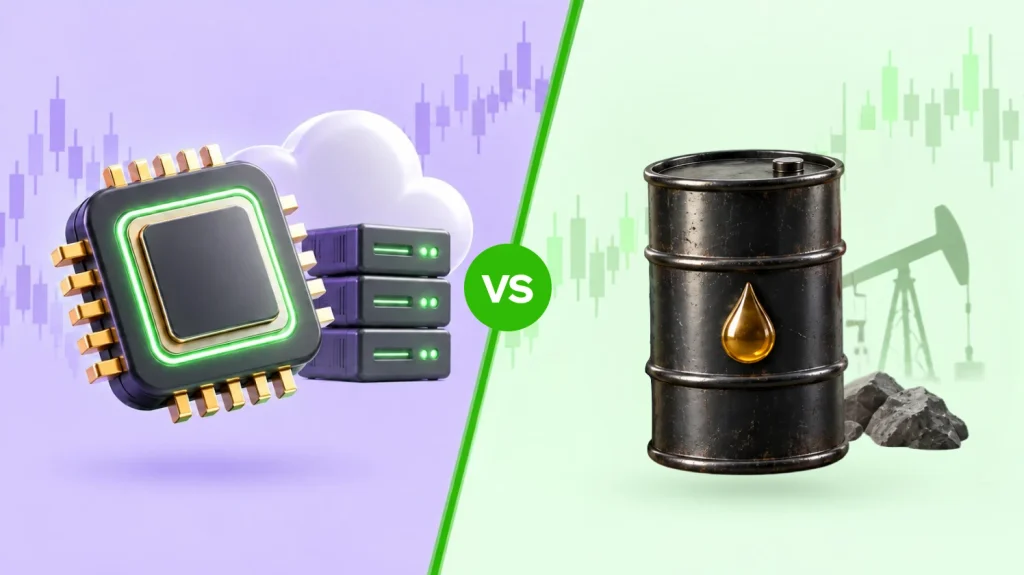
The two do not move in lockstep. A cooling US economy often drags on oil demand and pushes the barrel price down, while a supply squeeze can send oil up even as tech drifts. That loose link is what gives the pair its character. Buy the pair when your read is that tech leads and the barrel lags. Sell it when your read is that oil runs harder than the index, on an inflation scare or a supply shock. You are picking which engine of the market you think pulls ahead.
When to trade Nasdaq 100 vs Crude Oil
Once you have a side, here is how a view turns into a position. Each setup below is a way of reading the same tech-versus-oil split. None of them is a prediction of where either market will go.
Scenario 1: A risk-on tech session
Situation: Money is flowing into US growth and tech stocks while crude oil stays quiet on steady supply.
The trade: If you expect the Nasdaq 100 to stretch its lead over a calm oil market, that is a Buy on the pair, because you expect the index to gain more than crude in percentage terms.
Action: Open it on a demo account first to see how the pair reacts, then set your stop-loss and take-profit before going live.
Enter the market accessibly. Start a Standard Account from just $10 and take it from there.

Scenario 2: An oil supply shock
Situation: A production cut or a geopolitical flare-up lifts crude oil while higher energy costs feed rate fears that weigh on tech.
The trade:
Sell Nasdaq 100 vs Crude Oil. If you expect oil to outrun the index while tech softens, taking a Sell position captures that entire relative view in a single order without needing separate trades on both assets.
Action: Size the position for the sharper move oil can bring, place your stop, and rehearse it on demo before committing real funds.
Scenario 3: A longer growth-versus-inflation view
Situation: You hold a multi-week view that US growth is cooling and inflation keeps oil supported, or the reverse: that tech is entering a strong earnings run while energy stays soft.
The trade: Buy if you back tech to lead over the stretch. Sell if you back oil. Because the group is swap-free, holding the position across several sessions incurs no overnight swap charge.
Action: Build the position around your timeframe, mark the levels that would prove the idea wrong, and manage it from the MT5 app on desktop or mobile.
The pair at a glance
The facts that shape how you trade this CFD:
Platform: MetaTrader 5: desktop, WebTrader, Android, and iOS.
Gearing: 1:100 (a 1% margin requirement).
Spreads: Floating, roughly in line with the two underlying spreads.
Swaps: None. The Versus Pairs group is swap-free.
Trading hours: Open when both the Nasdaq 100 and the crude oil market are active (server time GMT+3).
Daily Trading Breaks: Clarify that trading pauses during the daily futures market break (typically 17:00–18:00 ET / 22:00–23:00 GMT) when both CME (Nasdaq 100) and NYMEX (WTI) underlying markets close temporarily.
Demo: Available with real-time pricing.
Price history: Available since the Versus Trade launch in April 2024.
Dividends: A dividend adjustment applies to the Nasdaq 100 index leg according to the broker’s dividend-adjustment schedule. The WTI leg has none.
Dividend Payout Details: On an ex-dividend date, holding a Buy position credits dividend payments to your account, while holding a Sell position debits (deducts) dividend payments from your account.
All standard MT5 analytical tools apply to the pair, and the Nasdaq 100 vs Crude Oil chart in MT5 shows its full price history across the timeframes you trade.
The performance gap, in one line
Because the relationship between the two markets changes over time, the Nasdaq 100 vs Crude Oil correlation varies over time and can flip between positive and negative as the macro backdrop changes. That is what keeps the pair active. Stretches where tech and oil drift apart produce the widest moves, and the Nasdaq 100 vs Crude Oil performance over any window is the story of that gap opening and closing. Reading the pair’s own chart in MT5 shows relative strength between the two on a single price line.
FAQ
Is Nasdaq 100 vs Crude Oil the same as trading US100 or WTI?
No. US100 and WTI are single-asset CFDs, each priced against the dollar. This pair is one instrument priced as the index level divided by the oil price per barrel, so its value moves on the percentage gap between the two. You hold a single position.
Can I trade crude oil vs Nasdaq 100, with oil first?
The instrument direction is fixed with the Nasdaq 100 as the base. To back crude oil to outperform, you sell the same pair. There is no separate oil-first symbol because the Sell side already gives you that view.
Should I invest in the Nasdaq 100 or crude oil?
That is a call only you can make. If your view is that tech leads, that is a Buy on the pair. If your view is that oil leads, that is a Sell. Versus Pairs give you one instrument to act on that call. The direction and timing are yours.
Does holding the pair overnight incur a swap charge?
No. The Versus Pairs group is swap-free, so a multi-session position incurs no overnight swap charge. That helps when you are trading a growth-versus-inflation view that plays out over days.
How does gearing work on this pair?
The pair offers 1:100 gearing, with a 1% margin requirement. Gearing magnifies both sides of the outcome: gains and losses are boosted relative to the margin committed. Set your stop-loss and position size with that in mind.
Does the pair pay dividends?
The WTI oil leg has no dividend. The Nasdaq 100 index leg does have a dividend adjustment, according to the broker’s dividend adjustment schedule. This is applied based on whether your position is long or short. Swaps do not apply either way.
When and where can I trade it?
On the Versus Trade MetaTrader 5 platform: desktop, WebTrader, and the Android and iOS apps. The pair is tradable only while both underlying markets are open, so its hours follow the overlap of the Nasdaq 100 and crude oil sessions (server time GMT+3). You can test it on a free demo with real-time pricing before trading live.
Trade Nasdaq 100 vs Crude Oil
Nasdaq 100 vs Crude Oil turns a view you may already hold, that tech leads or that oil leads, into a single position you can act on. Pick your side: Buy for the index, or Sell for the barrel, and place the trade in MetaTrader 5. New to the pair? Open it on a free demo with real-time pricing, watch how the gap drives the price, and then move to a live account when you are ready. One instrument, one trade, only at Versus Trade.
Risk warning: CFD trading involves significant risk and can result in the loss of your capital. The pair uses gearing, and relative moves and gearing can work against you as well as for you. A dividend adjustment applies to the Nasdaq 100 index leg according to the broker’s dividend-adjustment schedule. None of the above is trading advice. Trade only with money you can afford to lose.